Did you notice that in mid-August 2025, sea temperature along the Cantabrian coast dropped nearly 4 °C in just five days — in the middle of summer?
The Summer Spiral
Here is the story of what happened, told with wind data, satellite imagery and in-situ sensors.
It all started
with the wind.
In the first fortnight of August 2025, anyone wading into the Cantabrian coast noticed the water was colder each day than the previous one — raising doubts about whether a northern summer holiday had been the right decision. Nearly 4 °C less in a matter of days, in the middle of summer.
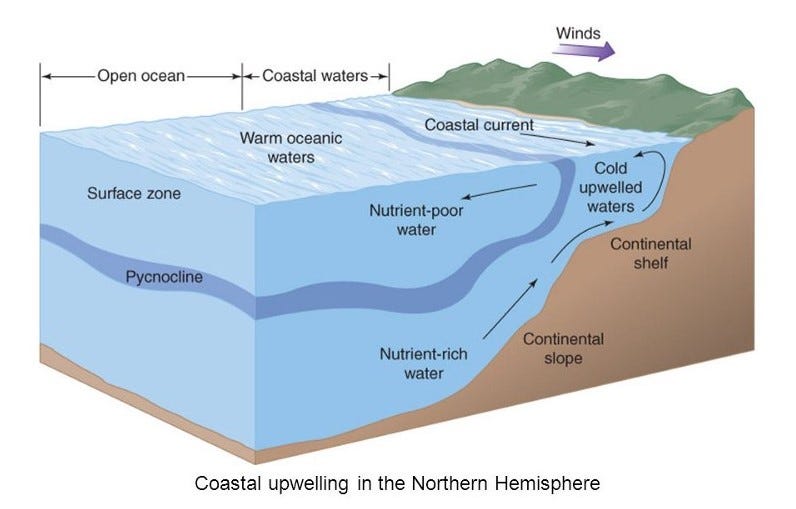
Winds blowing from east to west along the Cantabrian coastline, between the Basque Country and Galicia, explain the phenomenon. During the first days of August, successive wind pulses pushed the surface layer northward, away from the coast. Cold, dense bottom water rose to fill that gap: what we know as coastal upwelling.
The map on the right shows it. Look for the northeast wind signal between 3 and 8 August and observe how the blue tones of cold satellite-recorded water strengthen along the coast from Galicia to Cantabria. The red dot marks the location where one of our sensors recorded the lowest temperature of the episode, at Locos beach in Suances.
Key episode data
“The net Ekman transport is directed 90° to the right of the wind stress.
Along an east-west coast under northeast winds, that means offshore.”
Wind, upwelling index, and what the sensor measured
The top panel shows wind speed over the Cantabrian coastal box, with the easterly (upwelling-favourable) component coloured in orange. You can clearly see how easterly winds take centre stage from late July to mid-August, building in pulses.
The middle panel shows the Coastal Upwelling Index (CUI): the difference between open-sea Cantabrian SST (44.5–46.5°N) and the coastal strip (43.0–43.7°N), from CMEMS L4 satellite. The index crosses zero around 7 August — the signal that upwelling is active — and stays positive for the rest of the month. Coastal cooling arrives 4–5 days after the wind, following the ocean’s thermal inertia. The satellite records a coastal temperature minimum of 20.3 °C around 19 August.
The bottom panel shows data from our in-situ surfclim sensors. Temperatures stay below 20 °C and touch 17.4 °C on 13 August — almost 3 °C less than what the satellite was recording at the same time. The two minima coincide neither in time nor in magnitude. Why?
Because satellite L4 data is a spatial average of limited resolution. It combines signal from multiple pixels and applies smoothing, which works well offshore but systematically underestimates the intense gradients that form in the nearshore band during upwelling. The coldest waters upwell right on the first coastal strip, where the satellite cannot resolve fine structure and mixes that cold signal with warmer surrounding water — water that is systematically warmer than what anyone wading in the sea actually feels. This is why measuring at the beach matters.
Wind: ERA5 reanalysis, coastal box lon [−7 to −4°], lat [43–44°N]. CUI = offshore SST (44.5–46.5°N) minus coastal SST (43.0–43.7°N), CMEMS IFREMER L4; positive = coastal cooling. Observations: surfclim EnvLogger sensors, daily minimum.
Why does the water flee the coast?
The answer lies in what is known as the Ekman spiral. When wind blows from the east, it drags the surface layer slightly to the right. That layer in turn drags the next one also to the right, and so on — the effect attenuating with depth and forming a spiral. The net result is that an entire column of water, the Ekman layer, shifts 90° to the right of the wind. This deflection is caused by the Coriolis effect, a direct consequence of the Earth’s rotation.
With easterly wind over the Cantabrian, that transport points north, driving surface water away from the coast. Cold, dense, nutrient-rich water rises from depth to replace it. These nutrients are the engine of marine life and trigger intense biological productivity — what stopped being a tourist attraction for people became one for marine life.
For surfers, this has a practical implication. The tools most people use to check water temperature — forecast apps, satellite SST overlays — are not built for the nearshore. They see the shelf average, not the upwelling tongue that reaches the break. A 3 °C gap between what the app says and what the water is doing is not a glitch; it is the resolution limit of the product. Knowing that changes how you pack your bag.
← Back to the dashboard